This blog post reports on work-in-progress within the DfG course! The post is written by group 1C working in collaboration with the Digital Population and Data Services (DVV) and the Ministry of Finance (VM) on the project ‘Life events for a dignified old age’. The group includes Myrta Brugger and Emilia Ahlroos from Collaborative and Industrial Design program, Martin Guyot from Creative Sustainability program, and Tom Bos from Aalto Business School.
Written by: Myrta Brugger
Change of perspective
I arrived in Finland a year ago. It was my first time experiencing a foreign country as a resident. With the move, I became a client of various government agencies. During this course, I switched to the role of a designer.
We are now five weeks into researching the life event of retirement. Our research journey gave me a new perspective on Finland, its history, and its culture. And above all, it opened a deeper understanding of a group of people who are at the end of their working lives, right through to old age. In this sense, the group we must learn more about is far from my reality. For someone like me, a designer using ethnographic methods, this is a great opportunity. The differences between us reduce the risk of personal bias, such as confusing myself with the target group. It allows me to approach the subject with curiosity. In this sense, I am a double foreigner.
The convergent mode in research
My group looked at the organisational perspective of this life event. After gathering a lot of information, we stopped to make sense of its meaning. In the typical designer mode, this would be the first diamonds’ closing part (Design Council, 2015). I often find this part the most difficult. By analysing, we make choices. We go from the trees to the forest. Insights are generated – using abductive thinking – which helps us generate little packages combining different sources (plants!), revealing a new understanding. This reframing of plants offers a new view of the landscape and makes it easy to transfer research analysis into the next phase.
Grasping the complexity
Starting with the Finnish retirement system we wanted to expand to organisations across sectors to grasp the different perspectives of what it means to have a dignified old life. An ambitious goal. First, we got stuck with the retirement system, but let me take a step back.
While starting to make sense of the information, we got introduced to systems thinking. Donella H. Meadows (a must-read!) revealed to me a new way of thinking about the world and its systems (Meadows, 2008). Suddenly, I had a reason to question the short-term news flashes and found some beauty in bringing structure into what is often complex and hard to grasp.
“If the news did a better job of putting events in historical context, we would have a better behaviour-level understanding, which is deeper than event-level understanding. When a systems thinker encounters a problem, the first thing he or she does is look for data, time graphs, and the history of the system. That’s because long-term behaviour provides clues to the underlying system structure. And the structure is key to understanding not just what is happening but why.”
– Meadows, 2008, p.89
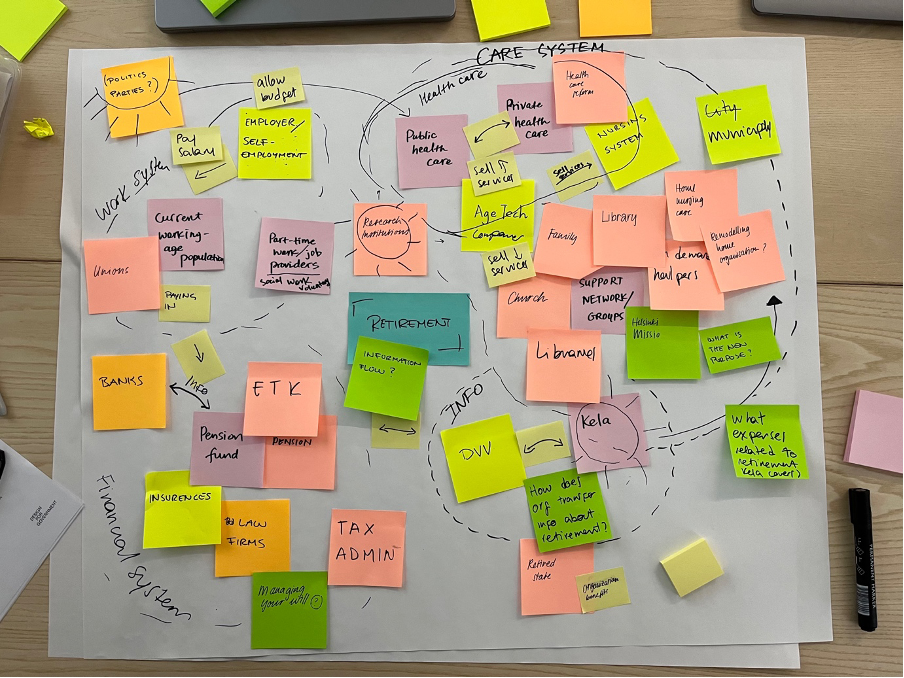
First system iteration flipchart
Coming back to our system at hand. We started to draw elements e.g., actors such as the employer, health insurance or family and what we assumed the relationships were in-between those groups, first iterations using paper, flipcharts and post it’s. It was chaos. But as with everything, it is crucial to start somewhere. Our starting point was the retirement system. It took a lot of time and additional research to map out the flows. My frustration increased because in my eyes we were mapping what everyone else already knew. In retrospect, I was too deep in the forest to see how it could make sense.
Through tutoring, I realised that by mapping the ‘obvious’ we created a powerful starting basis that can be used in itself – without adding the rest of the forest, to stay with that image. Let’s take that (currently) balanced system and test it by throwing “stressors” at it. What happens with the system when faced with future trends?
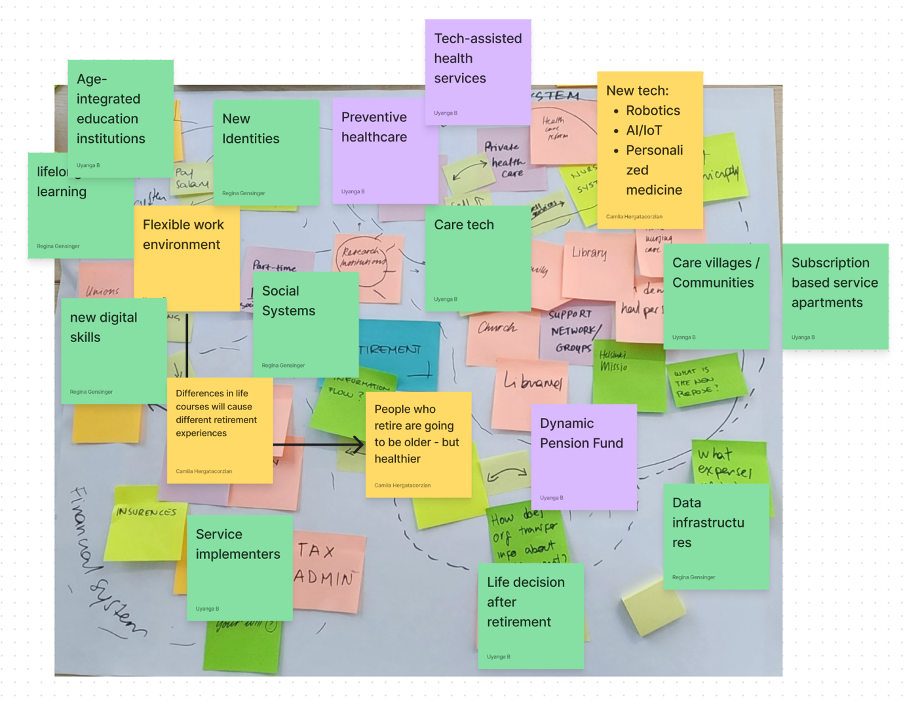
Overlapping trends on clusters by Group 1B
Not only future trends helped us gain insight. We spoke to three experts who told us about their work around ageing, being an older adult, retirement itself and the old-old age. Including, their perception of what it means to have a “dignified old age”. You might notice that I struggle a bit with finding labels for different age groups – because one of the things I learned is that we should stop calling them all “old” since life expectancy has grown (Johnson, 2021) and there is a clear difference between being 60 and 90. In a way, it is generally questionable whether all these categories matter for a dignified life because no matter what age we are, we want to belong and for our lives to have meaning (Topo, 2023).
Coming back to our journey, we continued to develop the systems map based on these conversations and what we learned from the teams working on user research and trends. In essence, the system map is not a result in itself, but a way to get there. The realizations we made along the way formed the main insights. The map was a means to group the right trees.
Time to close
Through my career so far, I am used to going through the design process from a facilitator’s perspective. From this perspective, one should not switch too quickly between divergent and convergent modes (Camacho, 2018). As a design practitioner in this project, however, I found it difficult to follow that rule. Towards the end of the analysis of our research (converging), we continued to look for more information (diverging). That is, we were using a diverging mode in a converging phase. As a result, the more I learned, the more I thought there was not enough information to draw conclusions. Under the premise of working iteratively to grasp this complex topic, this is ok – is what I say to myself. But when you always aim for more information with a diverging mode, it makes it hard to stop and see what is already there. Let’s take a breath and go for a walk in the forest.
References:
Camacho, M. (2018). An Integrative Model of Design Thinking. 627–641.
Design Council. (2015). Design Council: Design Methods for Developing Services . https://www.designcouncil.org.uk/resou rces/report/design-public-good
Meadows, D. H. (2008). Thinking in Systems: A Primer (D. Wright, Ed.). Chelsea Green Publishing.
Otis, D. (2017) [Photograph of Forest].Unsplash License. https://unsplash.com/photos/OYFHT4X5isg?utm_source=email&utm_medium=referral&utm_content=photos-page-share
Johnson, S. (2021, August). How humanity doubled life expectancy in a century [Video]. Ted Conferences. https://www.ted.com/talks/steven_johnson_how_humanity_doubled_life_expectancy_in_a_century
Topo, P. (2023). Expert Interview with Ombudswomen of elderly people [Transcript].
The DfG course runs for 14 weeks each spring – the 2023 course has now started and runs from 27 Feb to 31 May. It’s an advanced studio course in which students work in multidisciplinary teams to address project briefs commissioned by governmental ministries in Finland. The course proceeds through the spring as a series of teaching modules in which various research and design methods are applied to address the project briefs. Blog posts are written by student groups, in which they share news, experiences and insights from within the course activities and their project development. More information here about the DfG 2023 project briefs.