
This blog post reports on work-in-progress within the DfG course! The post is written by one of the two groups dealing with the Ministry of Environment’s project brief on ‘Energy and maintenance in Finnish housing companies’. The group includes Andre Vicentini from Aalto ARTS, MA in New Media Design and Production, Anssi Laurila from Aalto BIZ, MSc. in Entrepreneurship & International Design Business Management (IDBM), and Simone Menge from Aalto ARTS, MA in Creative Sustainability (Design).
This blog post is about our ongoing project for the Environmental Ministry towards sustainable housing renovations and the reimagined role of ‘energy experts’.
We’ve travelled a long and fruitful path since the midreview presentation a couple of weeks ago. After analyzing our feedback from participating stakeholders, we had a debrief with the DfG teaching team. Based on this, we started clustering the findings in a more specific way and defining the different, interwoven problems we are possibly going to work with.
How many post-its can you fit on one wall?
Having a common language and understanding is crucial for all our multi-disciplinary project teams. It is also needed for communicating our findings and the possible concepts to the public later on. To create this common language and sharpen our understanding, we did a second version of the affinity diagram, which was introduced already earlier on in the course’s during the empathy lectures by DfG teacher and design researcher Juha Kronqvist.
‘Affinity diagram’ is a tool to organize ideas and data. The ideas and data (based on research, interviews, …) are written down and clustered in relation to each other to finally be able to label each group with one (or several) term(s) or statement(s).
We clustered statements from our interviews, desk research and feedback and insights we got from the mid-term presentation. Our (and the teaching) aim was to reduce all our findings to a smaller amount of fruitful problems and specify our understanding of the issues stated in the brief and by our stakeholders.
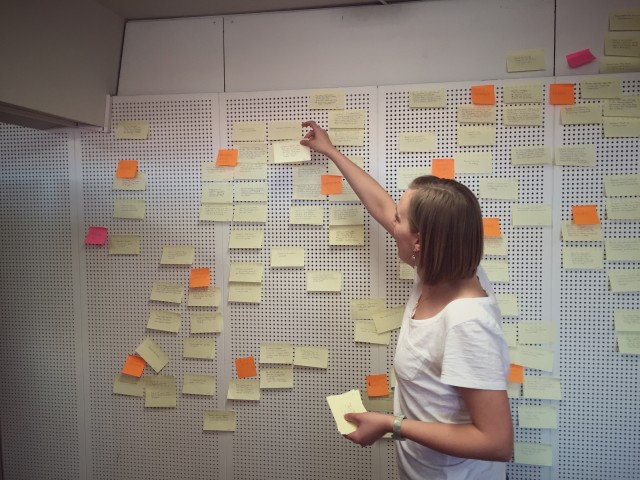
The ‘affinity diagram’ helped us to define our findings and possible problems more clearly and made it visually apparent where opinions, knowledge and insights from our research and our different stakeholders are overlapping. Based on this we could and can start evolving possible leverage points for future solutions.
It’s always better to know more…
…and because of this we organized some more interviews, for example with Timo Tossavainen from Kiinteistöliitto to find out about strategies and the future of housing companies and Marja Salo from SYKE to hear about their interesting project ‘Ekokoti‘. Through this, our viewpoint shifted more towards the future, and we became more and more aware that the surrounding world will keep changing as well. So, technological solutions that might not exist yet might be possible and valid outcomes in the coming years. A notion worth mentioning is that even though the current board members of housing companies (who have an average age of 67) and the housing companies’ systems in general are not currently particularly technologically-oriented, they will be more so in the future as next generations take over.
“We can’t solve problems with the same thinking we used to create them” – Albert Einstein
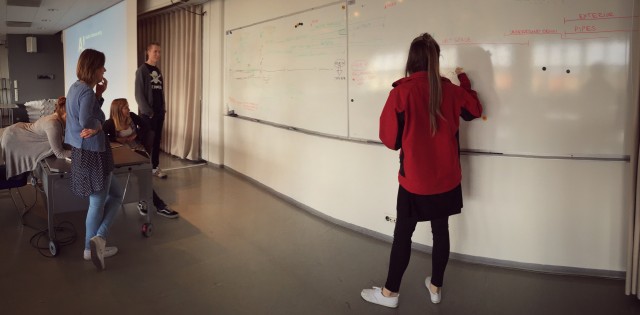
We had a session with social scientist Taneli Heinonen from the DfG teaching team last week and did some ‘problem exploration’. It was very helpful to have him over because we were able to take a step back and discuss the different approaches and parts of the system we could possibly nudge or even push with novel approaches. The session started where we stopped with the statements and insights from the ‘affinity diagram‘ and narrowed down towards the problems. We discussed the problems and at the end of the session each group member gave a really fast statement on: ‘What do you see as the most fruitful problem at the moment?’ This was really helpful since each of us were stuck with our own perception of the brief. So this individual, spontaneous framing of our own perception opened up possible pathways we could take – from community to open and big data and perceptions of technology: we have a broad variety of options (and opinions). The variety is a blessing and a curse at the same time. Receiving feedback from the entire team made us get real again after all the discussion and clarified that one’s own approach and understanding of the issue might not be the only and right way to go. Another step towards our common language and understanding!
Nudging and pushing further
After the ‘midterm excitement’ the behavioral insight section of our lectures started. Design researcher Seungho Lee from the teaching team introduced us to this term and some theory. As we learned, behavioral insight can be seen as ‘psychology meets economy’ and it is about unconventional design solutions (as you address the behavior of people) and understanding you own bias.
https://www.youtube.com/watch?v=BgRoiTWkBHU
‘How behavior can be influenced.’ Video: youtube.com
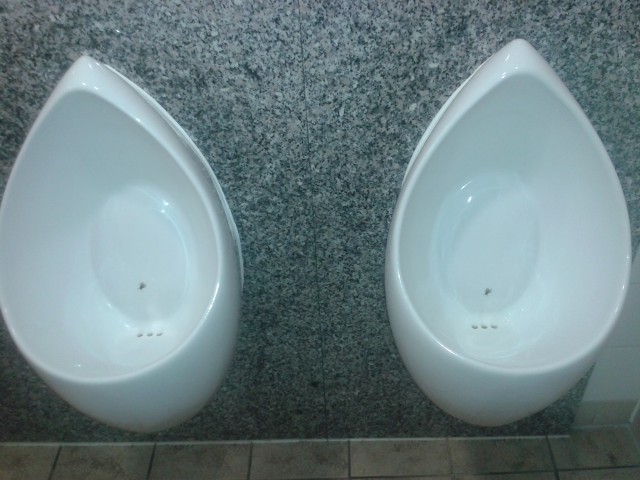
The main focus of the first lecture of this block was ‘nudges’ and showing that the best solutions are invisible.‘Nudging’ is a theory from behavioral science. Through small and indirect suggestions and positive reinforcement it is possible to influence the behavior of individuals and groups of people. Small, and maybe almost invisible and unnoticed, approaches can have a huge effect.
Look at this example of a fly sticker in the urinal by Sphinx which nudges men to aim and reduces cleaning costs. The idea was first created by Jos van Bedaf, manager of the cleaning department at Amsterdam’s Schiphol Airport.
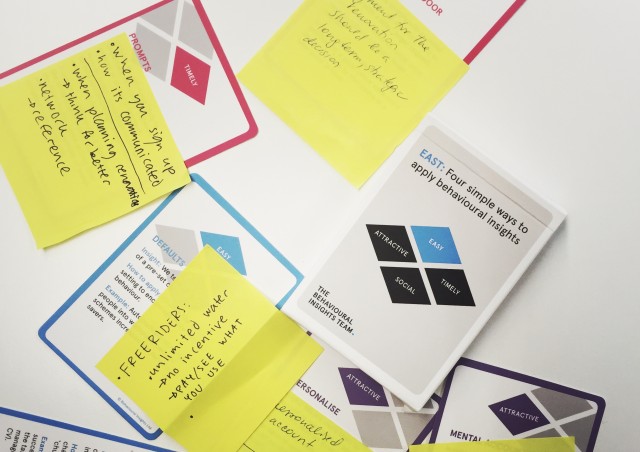
The following week we had a guest lecture by Managing Director Markus Kanerva from the think tank ‘Tänk’ He further guided us into behavioral economics and the work of BIT behavioral insights team in the UK. He introduced a toolkit created by them called ‘EAST’ with four simple categories ‘Easy, Attractive, Social and Timely’ to apply behavioral insight. Each category provides insights, ‘How to apply’-instructions and an example for a subcategory. The cards can be used to start the discussion about the subcategories and their implementation in your current project. After Markus’ introduction we got the chance to use the toolkit ourselves – a really interesting experience which helped starting our ideation process and pushed us still further.
To the Future!
Things have been moving fast during DfG and right now we are ready to start working towards the possible solutions. From this aspect, the course has been profound in introducing new working tools and crafting the pathways towards solutions that we now possess.
The DfG course runs for 14 weeks each spring – the 2016 course has now started and runs 22 Feb to 28 May. It’s an advanced studio course in which students work in multidisciplinary teams to address project briefs commissioned by governmental ministries in Finland. The course proceeds through the spring as a series of teaching blocks – Empathic Design, Systems Thinking and Behavioral Insight – in which various research and design methods are applied to addressing the project briefs. Blog posts are written by student groups, in which they share news, experiences and insights from within the course activities and their project development. More information here about the DfG 2016 project briefs. Hold the date for the public final show on Tues 24 May and sign up here!